Due to the advancement of metallurgy a lot many different materials are now used in mechanical construction industry. In this a few are heat treated to improve mechanical properties.
Heat treatment is done because of two reasons 1 ) Process requirement 2) Material Requirement
Heat treatment can be done in many ways. Furnace heating, Oil fired heating, Electric resistance heating etc.
There are different type of heat treatments like normalizing, annealing etc.
Here we are going to discuss about the graph which is generated in electric resistance heating for PWHT (Post Weld Heat Treatment).
Reading a PWHT chart is what is going to be discussed here....
Below is the graph of a pwht process. Lets start reading it.....(Here i am discussing on the understanding that you are a little bit familiar with the process....)

In this chart,
X-axis represents temperature and Y-axis represents Time.
In X-axis each line to line distance represents 10Deg C (See it is written as X 100°C, that means in X axis, 2 means 2 X 100°C= 200°C, 3 means 3 X 100°C= 300°C etc.)
In Y-axis each line to line distance represents half an hour. That means the time between 2 and 3 represents one hour.
These are the basics.
How to read the graph?
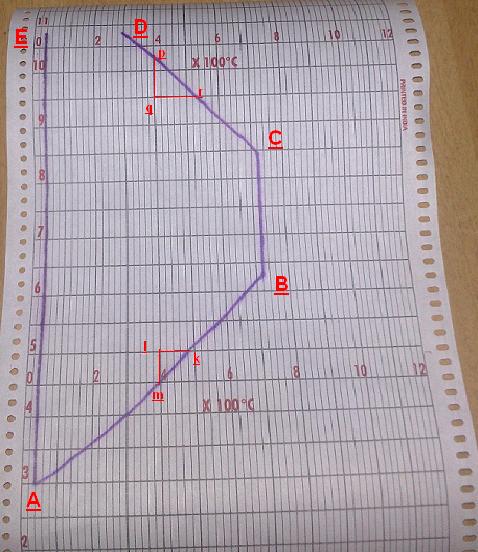
The graph contains several lines, AB, BC, CD, AE
1 ) AB is RATE OF HEATING curve
2) BC is SOAKING TEMPERATURE
2) BC is SOAKING TEMPERATURE
3) CD is RATE OF COOLING curve
4) AE is ROOM TEMPERATURE curve
When you check the WPS you can see the required values for each of these.
1) AB: Rate of heating: In WPS it is mentioned as a maximum value. In the graph the rate of heating is the slope of the curve AB. So the value of the slope should not be more than the value in WPS.
How to calculate the slope:
Slope = kl/lm
Now in the graph given above, for AB line, kl=80DegC and lm=1/2 hr
slope = 80 / (1/2) = 160DegC/hr ; So in this graph the rate of heating is 160DegC/hr.
2) BC: Soaking Temperature: In WPS it is mentioned as a single value with some plus/minus allowance along with time it is to be steady(mentioned as minimum)
Here in this graph it is 720Deg (Reading in X-axis) and for approximate 2hr and 10minute(this is an approximation-Reading in Y-axis )
3) CD: Rate of cooling: In WPS it is mentioned as a maximum value. In the graph the rate of heating is the slope of the curve CD. So the value of the slope should not be more than the value in WPS.
How to calculate the slope:
Slope = qr/pq
Now in the graph given above, for CD line, qr=130DegC and pq=45 Min(this is taken as an approximation from the graph.)
slope = 130 / 45 = 2.89DegC/Min ; So in this graph the rate of heating is 173DegC/hr.
4) AE: Room Temperature: This is the room temperature, here it is 40 deg C.
Loading Temperature: Loading temperature is the temperature at which controlled heating (maintaining the rate of heating in the WPS) starts, up to which there is no need for controlled heating.
Unloading Temperature: Unloading temperature is the temperature up to which controlled cooling (maintaining the rate of cooling in the WPS) occurs, below which there is no need for controlled cooling.Normally the power connection is disconnected below the temperature, keeping the insulation. After getting cooled to the atmospheric temperature the insulation is removed.
NB: Please check the speed of the chart movement in the PWHT machine, Normally it is 25mm/hr.
------------------------------------------------------------------------------------------------------------
Please check the chart speed also, normaly it is 25mm/hr
ReplyDeleteThank You for your valuable suggestion.
Deletevery very useful information.
ReplyDeleteThanks for sharing
Thank you,
Deleteguro,very useful information
ReplyDeleteTHANK U .SO MUCH
ReplyDeleteTnx fr sharing a very useful info.
ReplyDeleteThank You for your valuable Information.
ReplyDeleteVery useful information. Mr.sreejith where the chart speed given as 25mm. Kindly mention.
ReplyDeleteThat you can usually see in the nameplate of the recorder. Most of the recorders are preset at this speed. Some recorders are with variable speed setting. The speed is designed such that the consecutive dots are nearer to each other.
Delete
DeleteChart speed is the most important thing which Hareesh missed.
It is already mentioned in the bottom of the blog. Please review.
DeleteVery Useful Information.. Thank you brother..
ReplyDeleteThank you for reading my blog. For getting notification on updations in this blog, please 'LIKE' https://www.facebook.com/MechConstEngineer
Deletehow to select p,q,r & k,l,m areas in shown chart; can we select randomly any where in chart or any guideline is there ? please clarify me.
ReplyDeleteThat you can randomly select at any location in the slope of the graph
Deleteit is not random location. For a chart like you shown, it can be random as the slope throughout the heating is same. Some times this will vary as the machine issue. In such cases we have to select the portion of graph were the heating rate is more. This is because WPS will be asking for the maximum rate of heating. So in any point this heating rate is more than that in the WPS, it has to be more closely consulted with Engg
Deletewrong
Deletethe recorder should be calibrated before using it on job and the variations will not be much. If variations are happening the heating unit should be properly checked and corrected. Another reason for the eratic variations in the graph is due to improper insulation on the heating coils along with weld joint.
DeleteVERY USEFUL INFORMATIONS
ReplyDeleteThank You.
DeleteSenthilkumarsethu4@gmail
DeleteThank u sir for ur guidence.... It is very useful for me
ReplyDeleteThank you for reading my blog.
DeleteFor getting notification on updations on this blog, please 'LIKE' https://www.facebook.com/MechConstEngineer
Supar
ReplyDeleteThank you for reading my blog.
DeleteFor getting notification on updations in this blog, please 'LIKE' https://www.facebook.com/MechConstEngineer
Have a doubt, for approximately 11mm the rate of heating has increased at the rate of 300 degree instead of 220 degree maximum. the temperature increase is from 380 to 510 degree with a distance of 11mm. after that the chart is exactly the same what you have above. Now will the chart be rejected for going above the max heating rate or its fine as the temperature rise above it is fine, soaking temperature is 630 degree as required and cooling rate is is below 220 degree as required. another concern is , what good effect can happen if this chart is rejected and asked for a new pwht cycle. or what actually is the effect of this rise in temp which is less than the critical temp., 725.
ReplyDeleteVery useful and well explained. Thanks for sharing
ReplyDeleteThank you for reading my blog.
DeleteFor getting notification on updations on this blog, please 'LIKE' https://www.facebook.com/MechConstEngineer
Thankyou for very fine suggestions .
ReplyDeleteThank you for reading my blog.
DeleteFor getting notification on updations on this blog, please 'LIKE' https://www.facebook.com/MechConstEngineer
how to select p,q,r & k,l,m areas in shown chart; can we select randomly any where in chart or any guideline is there ? please clarify me.
ReplyDeleteCan select randomly
Deletehello brother. If i took 720(soaking)-300(loading heat) = 420.
ReplyDelete420/ 135min =3.11
3.11 x 60 = 186.6 c/hr heating rates as per chart.
what i get from your chart.
The calculation that is shown is the required heating rate. How will you calculate the actual heating rate? How can you ensure that the required heating rate is available in the chart? If the heating rate is more how will you judge?
DeleteThe method mentioned is to evaluate a chart.
Thank you for reading my blog.
https://www.facebook.com/MechConstEngineer
Pipe me coil raping karne ka masserment kese nikale sir
ReplyDeleteHeating ka masserment bataiye sir
ReplyDeleteDear Sir,AE is straight line not a curve as you mentioned in your explanation
ReplyDeleteWe cannot say that it is a straight line. The difference in the atmosphere temperature will be reflected in AE.
Delete